Standard Score (Japan) Calculator
《Standard Score Calculation Results [ Data Count: ]》
Mean: -
Maximum Score: -
Minimum Score: -
Median: -
Mode: -
Passing Score:
Mean of Passing Scores: Undefined
Standard Deviation: -
Mean Absolute Deviation: -
Standard Deviation of Standard Scores: -
Maximum Standard Score: -
Minimum Standard Score: -
Median Standard Score: -
Upper Mean: -
Lower Mean: -
Variance: -
Coefficient of Variation: -
Q1 [First Quartile]: -
Q3 [Third Quartile]: -
IQR [Interquartile Range]: -
Skewness: -
Kurtosis: -
| Number | Name | Score | Standard Score | Rank |
|---|
《Distribution of Standard Score, Score, and Number of People》
An internet connection is required to display the standard score distribution graph.
About Standard Score (Japan)
The Standard Score (Japan) is an indicator that shows the relative position within a group. Even with the same score, different standard scores may be calculated depending on the population.
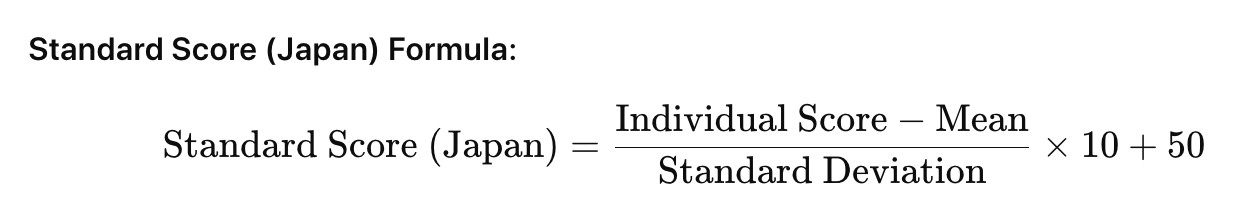
Additionally, depending on the distribution of the data, it may not always be an appropriate indicator. Please use the results of this tool as a reference only.The Standard Score (Japan) is calculated using the formula: (Individual Score - Mean) ÷ Standard Deviation × 10 + 50.
About "Median, Standard Deviation, Mean Absolute Deviation, Standard Deviation of Standard Scores, Variance, Coefficient of Variation, Q1, Q3, IQR, Skewness, Kurtosis"
📌 Median
The middle value when data is arranged in ascending order. If the number of data points is odd, it is the central value; if even, it is the average of the two central values. Unlike the mean, it is less affected by outliers.
📌 Standard Deviation
An indicator that shows the extent of variation in the data. It represents the average deviation from the mean, where a larger value indicates greater dispersion of the data.
📌 Mean Absolute Deviation (MAD)
An indicator that represents the magnitude of deviation from the mean. It is calculated by taking the average of the absolute deviations of each data point from the mean. Unlike the standard deviation, it is less affected by outliers.
📌 Standard Deviation of Standard Scores
An indicator showing the variation in standard scores. Similar to standard deviation, it represents how much deviation exists from the average standard score (50).
📌 Variance
An indicator that shows the extent of variation in the data. It is calculated by squaring the deviations of each data point from the mean and taking the average. A larger value indicates that the data is more widely distributed.
📌 Coefficient of Variation (CV)
An indicator that expresses the extent of variation relative to the mean. It is obtained by dividing the standard deviation by the mean and expressed as a percentage. It is useful for comparing datasets with different scales, where a larger value indicates relatively greater variation in the data.
📌 Q1 (First Quartile)
The value at the 25th percentile when the data is arranged in ascending order. It represents the first division when splitting the data into four equal parts.
📌 Q3 (Third Quartile)
The value at the 75th percentile when the data is arranged in ascending order. It represents the third division when splitting the data into four equal parts.
📌 IQR (Interquartile Range)
The difference between Q3 and Q1, representing the range of the central 50% of the data.
It is less affected by outliers and is used to assess the extent of variation in the data.
📌 Skewness
It is less affected by outliers and is used to assess the extent of variation in the data.
An indicator that represents the symmetry of the data distribution.
・ Close to 0 → Symmetrical (resembles a normal distribution)
・Positive value → Right-skewed (spread towards higher scores)
・Negative value → Left-skewed (spread towards lower scores)
📌 Kurtosis
・ Close to 0 → Symmetrical (resembles a normal distribution)
・Positive value → Right-skewed (spread towards higher scores)
・Negative value → Left-skewed (spread towards lower scores)
An indicator that represents the sharpness (peakedness) of the data distribution.
・ Close to 0 → Normal distribution (standard shape)
・Positive value → Sharp peak, more outliers
・Negative value → Flatter and more widely spread distribution
・ Close to 0 → Normal distribution (standard shape)
・Positive value → Sharp peak, more outliers
・Negative value → Flatter and more widely spread distribution
About This Tool
This tool processes all input data locally on your device. No data is sent to a server, and the execution of this program does not result in data leakage to external sources.Disclaimer
This tool is a simple Standard Score (Japan) calculation tool and is not suitable for use as an official grading evaluation. Additionally, accuracy of the calculation results is not guaranteed. The website bears no responsibility for any damages or disadvantages resulting from the use of this tool.