
🚀 宇宙の記憶・カレンダー検索
🚀 象徴的な写真:
APOD第1回
🚀 創造の柱
🚀 スピリット火星着陸
🚀 ハッブル超深宇宙
🚀 地球へようこそ|ブルー・マーブル
🚀 エンケラドス
🚀 ベテルギウス
🚀 火星着陸
🚀 青い夕焼け
🚀 冥王星のハート
🚀 皆既日食
🚀 アースライズ再構築
🚀 ブラックホール
🚀 ウェッブ初画像
🚀 アポロ11着陸
APOD30周年(2025年6月16日)
観測可能な宇宙の地図
A Map of the Observable Universe
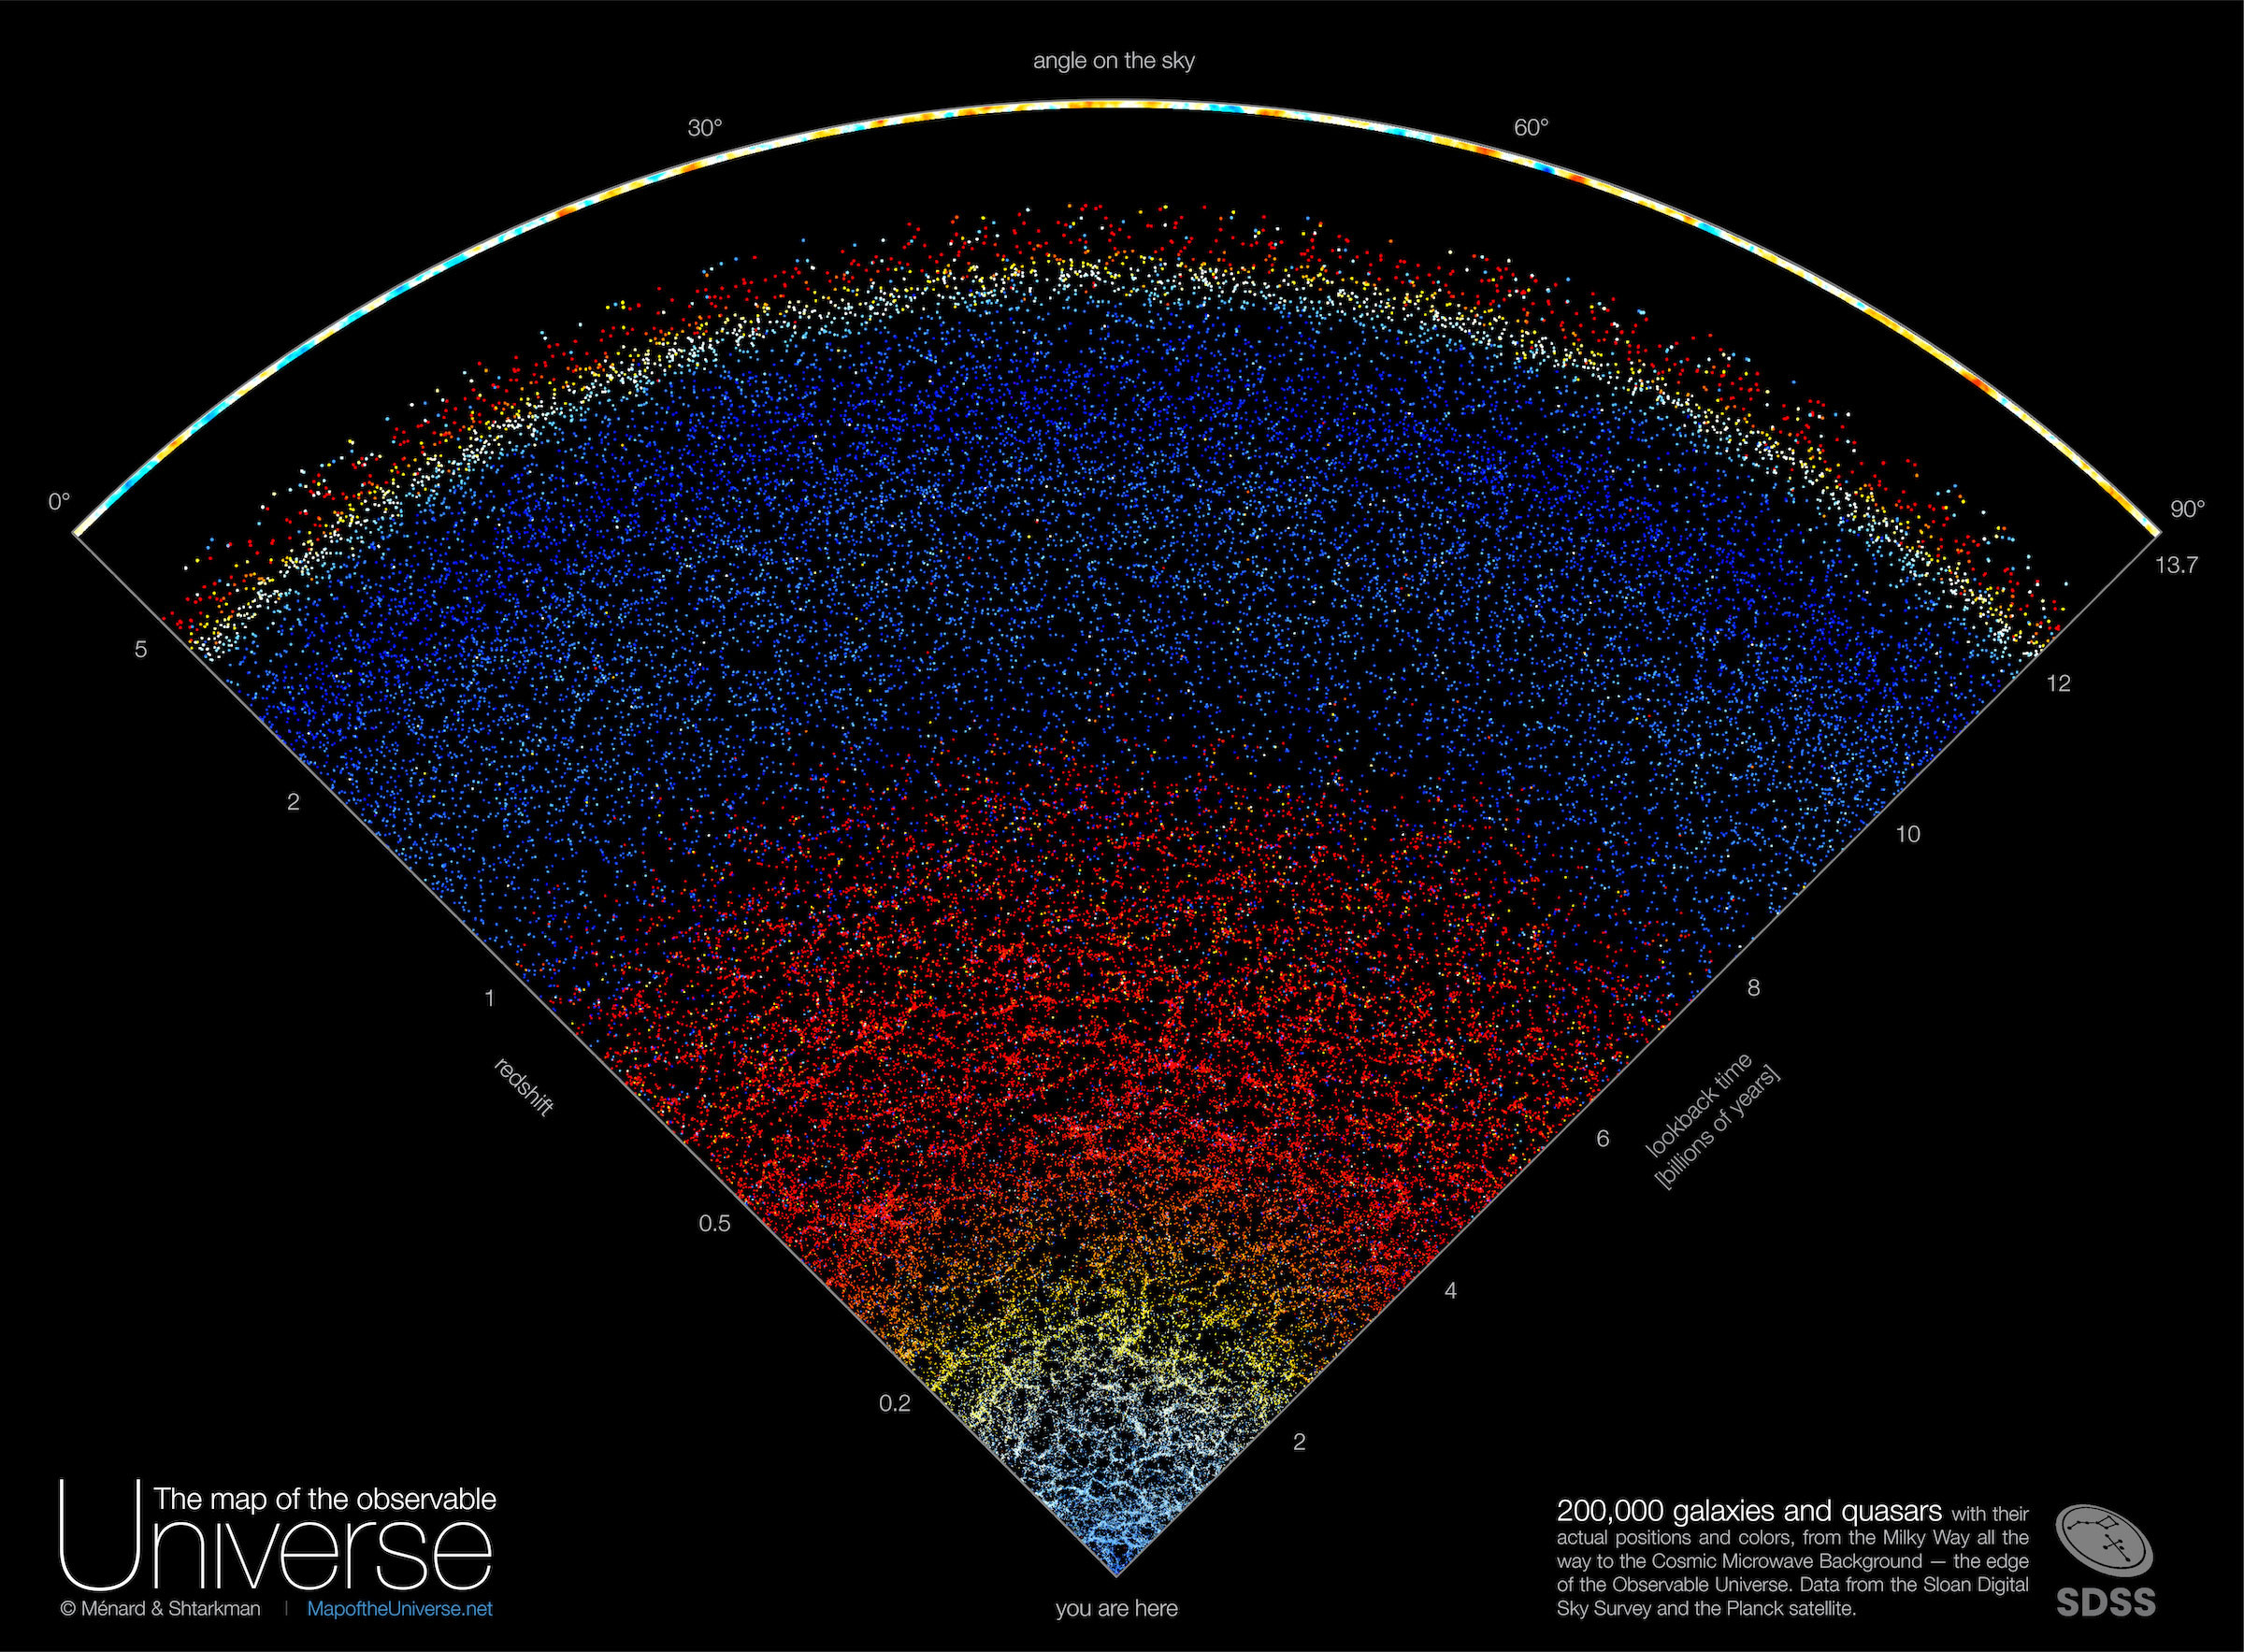
観測可能な宇宙の果てまで見渡せたらどうでしょう? 銀河、銀河、銀河、そして遠くの銀河の明るい中心部であるクエーサーが見えるでしょう。人類が見ることができる最大のスケールについての理解を深めるために、2000年から2020年にかけてスローン・デジタル・スカイ・サーベイによって発見された銀河とクエーサーの地図が作成されました。これは、観測可能な宇宙の果て近くまでを網羅しています。ここに示されているのは、このサーベイの1つの領域で、120億年以上前の時間軸と宇宙論的赤方偏移5を超える約20万個の銀河とクエーサーを包含しています。図の下部付近にあるほぼすべての点は銀河を表しており、赤みが強いほど赤方偏移と距離が大きくなることを示しています。同様に、上部にあるほぼすべての点は遠方のクエーサーを表しており、青みがかった点は赤みがかった点よりも近いことを示しています。多くの発見からも明らかなように、銀河間の重力によって近傍の宇宙は凝縮し、遠方の宇宙よりもますます細長い形状へと変化しています。より詳細な地図:今日のAPOD関連
原文(English)
What if you could see out to the edge of the observable universe? You would see galaxies, galaxies, galaxies, and then, well, quasars, which are the bright centers of distant galaxies. To expand understanding of the very largest scales that humanity can see, a map of the galaxies and quasars found by the Sloan Digital Sky Survey from 2000 to 2020 -- out to near the edge of the observable universe -- has been composed. Featured here, one wedge from this survey encompasses about 200,000 galaxies and quasars out beyond a look-back time of 12 billion years and cosmological redshift 5. Almost every dot in the nearby lower part of the illustration represents a galaxy, with redness indicating increasing redshift and distance. Similarly, almost every dot on the upper part represents a distant quasar, with blue-shaded dots being closer than red. Clearly shown among many discoveries, gravity between galaxies has caused the nearby universe to condense and become increasingly more filamentary than the distant universe. More Detailed Maps: Related to Today's APOD
\ この感動を宇宙仲間にシェア /
宇宙をXでシェア
© B. Ménard &
N. Shtarkman;
Data:
SDSS,
Planck,
JHU,
Sloan,
NASA,
ESA / APOD